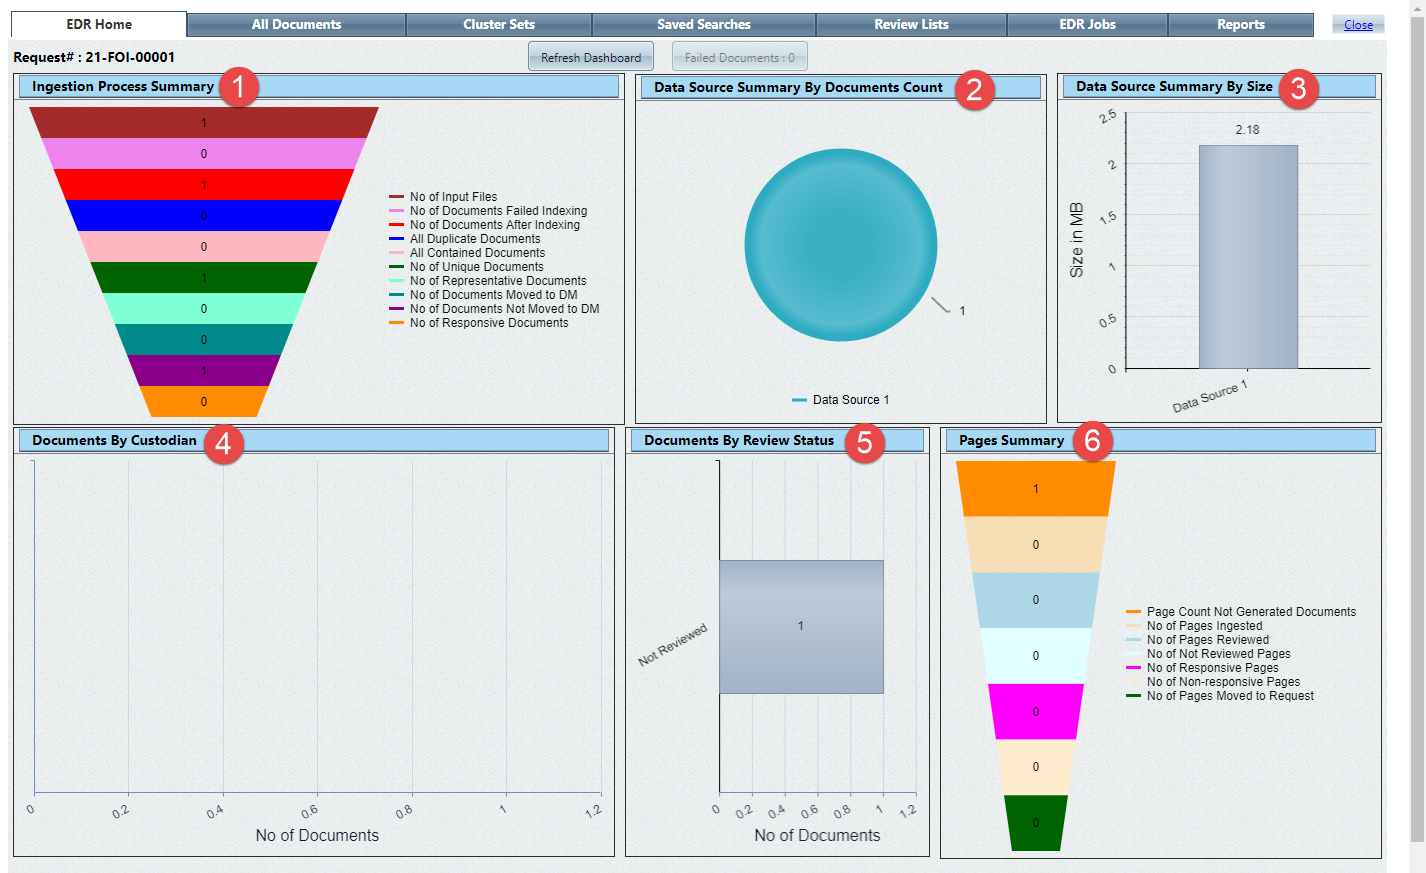
The EDR Home tab is the EDR landing screen, which displays when you open EDR from a case folder. The EDR Home tab displays useful information at a glance, with the ability to drill down and locate specific groupings of documents. An example EDR Home tab is shown below:
The tab includes six data visualizations, as described in the following table. Click any of the chart sections to drill down to that specific data set. For example, in the Ingestion Process Summary Chart, select the pink No. of Documents Failed Indexing bar to see a list of all documents (if any) that failed the indexing process.
|
Ref |
Graph | Description |
|
1 |
Ingestion Process Summary |
Summary of all documents ingested by status as related to the ingestion process. Select a bar to see all documents of the identified type, including:
|
|
2 |
Data Course Summary by Documents Count |
A pie chart including each data source as a portion of the total document count. Select a source to view all associated documents. |
|
3 |
Data Source Summary by Size |
Bar graph identifying each data source summary by the data source size. Select a source to view all associated documents. |
|
4 |
Documents By Custodian |
Chart displaying documents delineated according to the Custodian. Select a custodian from the chart to view all documents for the custodian. |
|
5 |
Documents By Review Status |
Bar graph showing each document status and the number of EDR documents currently in each status. Select a status to view all documents in that status. |
|
6 |
Pages Summary |
Breakdown of pages by summary, including the following statuses:
|
You can also click Refresh Dashboard at any time to refresh the data on the EDR Home tab.